Finance Ratios (Free)
-----------------
The Finance Ratio calculator is an easy to use financial calculator and educational app rolled into one. You can use it to:
* Calculate over 30 different financial ratios.
* Study the formulas for each of the ratios.
* Read detailed descriptions of what each ratio does along with tips on what to look for in your calculations.
This app will be of value to professional Stock Traders, Accountants and Bankers as well as students taking Business Studies, Accountancy and Finance courses.
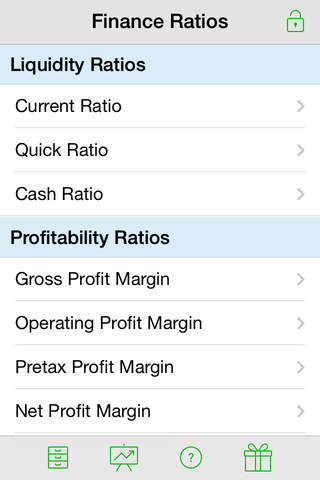
List of Financial Ratios:
Liquidity Ratios:
* Current Ratio
* Quick Ratio
* Cash Ratio
Profitability Ratios:
* Gross Profit Margin
* Operating Profit Margin
* Pretax Profit Margin
* Net Profit Margin
* Effective Tax Rate
* Return on Assets (ROA)
* Return on Equity (ROE)
* Return on Capital Employed (ROCE)
Debt Ratios:
* Debt Ratio
* Debt-Equity Ratio
* Capitalization Ratio
* Interest Coverage Ratio
* Cash Flow to Debt Ratio
Operating Performance Ratios:
* Fixed Asset Turnover
* Sales/Revenue Per Employee
Cash Flow Indicator Ratios:
* Operating Cash Flow/Sales Ratio
* Free Cash Flow/Operating Cash Flow Ratio
* Short-term Debt Coverage Ratio
* Capital Expenditure Coverage Ratio
* Dividend Coverage Ratio
* Dividend Payment Ratio
Investment Valuation Ratios:
* Price/Book Value Ratio (P/B)
* Price/Cash Flow Ratio (P/CF)
* Price/Earnings Ratio (P/E)
* Price/Earnings to Growth Ratio (PEG)
* Price/Sales Ratio (P/S)
* Dividend Yield
* Enterprise Value Multiple
Also included is a comprehensive Help file to make sure you get the most out of this app.
This app is Universal. It works on both the iPhone and the iPad.
* * * Can be upgraded to the Premium edition with an in-app purchase. * * *
Finance Ratios (Premium)
---------------------
You get all of the features of Finance Ratios (Free) plus the following advanced features when you upgrade to the PRO version:
* Save the results of your calculations to a database for future reference.
* Use line charts to analyze trends and averages.
* Email and Print charts/tables of database data.
* Compare and contrast data for multiple businesses or an entire sector.


